
In URP, coloring 10,000 cubes with a single cached MaterialPropertyBlock was about 6× slower than using renderer.material in my test. The property block saved roughly 10,000 Material objects, but it pushed every cube out of the SRP Batcher: SetPass calls went from 46 to 20,024.
renderer.material has a real cost too. It clones one Material per renderer, and those clones are not destroyed with the GameObject. My leak test grew by exactly +10,000 materials per rebuild until I destroyed them myself.
I started this experiment believing the opposite. This post is the record of how that belief got tested and flipped.
The rule I had learned was simple: renderer.material silently clones the material and breaks batching, and MaterialPropertyBlock fixes both problems. So before measuring anything, I wrote down three predictions:
renderer.material would add about 10,000 Material objects to memory.renderer.material would break batching, because every cube has a different material.MaterialPropertyBlock would keep memory flat and batch cleanly.Prediction 1 held. Predictions 2 and 3 turned out to be backwards in URP.
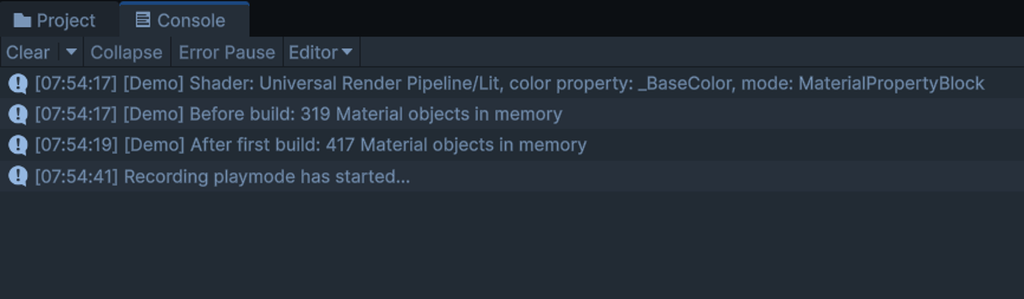
Universal Render Pipeline/Lit, color property _BaseColor.One boolean, UsePropertyBlock, switches between the two ways of coloring the cubes:
if (UsePropertyBlock)
{
    propertyBlock ??= new MaterialPropertyBlock();
    for (int i = 0; i < renderers.Length; i++)
    {
        propertyBlock.SetColor(colorPropertyId, Random.ColorHSV());
        // Values are COPIED into the renderer, so one block can be reused.
        renderers[i].SetPropertyBlock(propertyBlock);
    }
}
else
{
    for (int i = 0; i < renderers.Length; i++)
    {
        // First access clones sharedMaterial into a new Material instance.
        Material m = renderers[i].material;
        m.color = Random.ColorHSV();
        clonedMaterials.Add(m);
    }
}
if (UsePropertyBlock)
{
propertyBlock ??= new MaterialPropertyBlock();
for (int i = 0; i < renderers.Length; i++)
{
propertyBlock.SetColor(colorPropertyId, Random.ColorHSV());
// Values are COPIED into the renderer, so one block can be reused.
renderers[i].SetPropertyBlock(propertyBlock);
}
}
else
{
for (int i = 0; i < renderers.Length; i++)
{
// First access clones sharedMaterial into a new Material instance.
Material m = renderers[i].material;
m.color = Random.ColorHSV();
clonedMaterials.Add(m);
}
}The script also has a Rebuild (leak test) context menu that destroys the whole grid and builds a new one, with an option to Destroy() the cloned materials first. Full script:https://github.com/tadakuniyasuda/MaterialPerformanceTest
The property block version was about 6× slower on both the main thread and the render thread. Each row below is the range across three Stats readings per mode.
| Mode | CPU main (ms) | Render thread (ms) | FPS | Batches | SetPass calls |
|---|---|---|---|---|---|
renderer.material | 20.8–25.8 | 15.0–17.7 | 38.7–48.1 | 20,024 | 46 |
MaterialPropertyBlock | 130.8–137.9 | 125.6–132.7 | 7.2–7.6 | 20,024 | 20,024 |
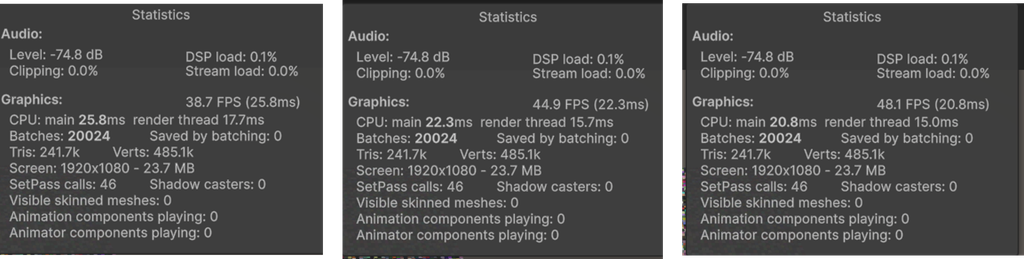
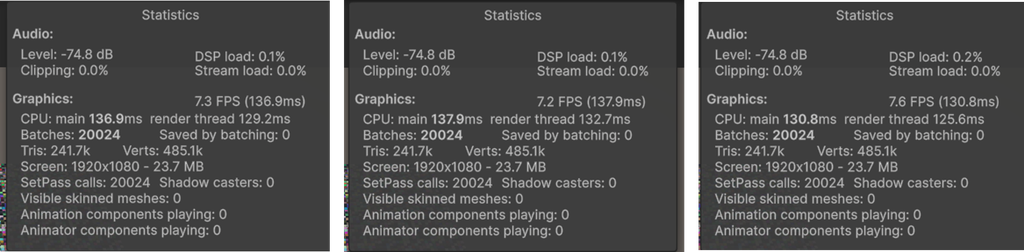
Batches stayed identical, so it was not the number that told the story. The SRP Batcher does not reduce draw calls; it makes the render-state setup between them cheap. SetPass calls is where that shows: 46 with 10,000 different materials, versus one per draw with the property block.
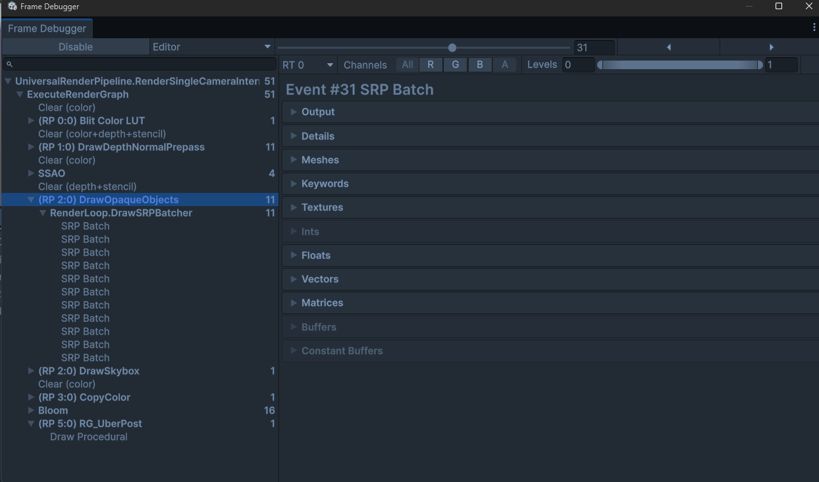
The Frame Debugger showed the batching difference directly, and Unity’s own “Batch cause” text explained it.
renderer.material | MaterialPropertyBlock | |
|---|---|---|
| Events under DrawOpaqueObjects | 11 | 10,000 |
| Parent node | RenderLoop.DrawSRPBatcher | RenderLoop.Draw |
| Event name | SRP Batch | Draw Mesh Cube_x_y |
| Draw calls per event | 909 (example batch) | 1 |
| Batch cause | SRP: First call from ScriptableRenderLoopJob | Objects have different MaterialPropertyBlock set. |
MaterialPropertyBlock
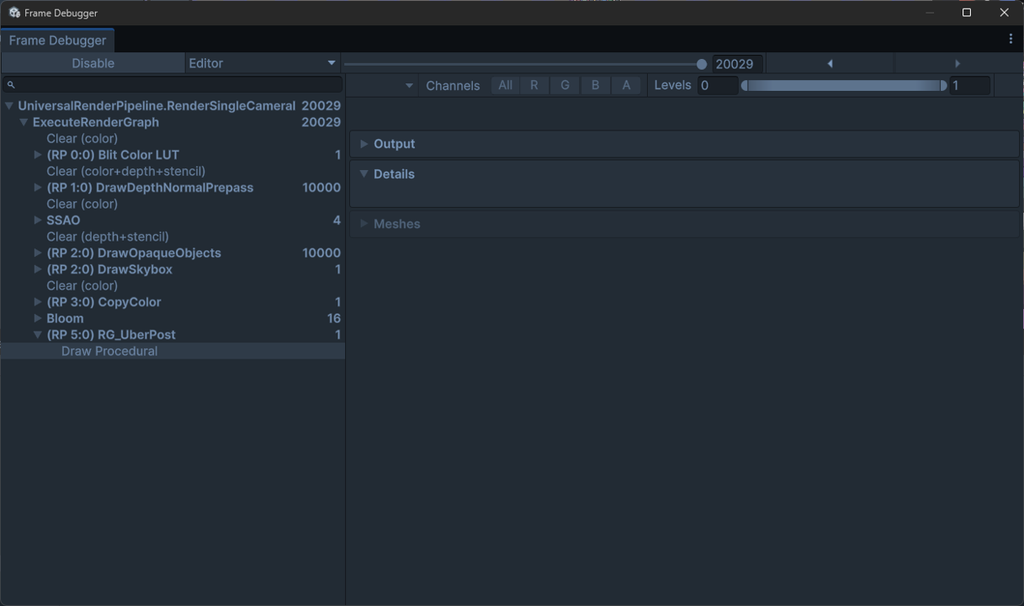
With 10,000 different materials, the whole opaque pass fit into 11 SRP Batches (11 × ~909 ≈ 10,000). With one material plus a property block, the parent node itself changed from DrawSRPBatcher to plain Draw, and every cube became its own event.
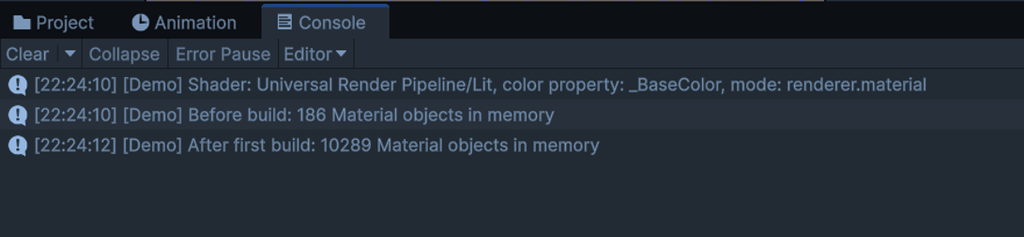
renderer.material added about 10,000 Material objects, and without cleanup they were never freed. I counted Material objects with Resources.FindObjectsOfTypeAll<Material>(), logged before and after each build. In the Editor this includes editor-owned materials, so only the change matters.
| Run | Before | After first build | Change |
|---|---|---|---|
renderer.material | 186 | 10,289 | +10,103 |
MaterialPropertyBlock | 203 | 306 | +103 |
About 100 materials appeared in both modes. I didn’t investigate where they come from; they are not the cubes.
Then the leak test, in renderer.material mode. Each Rebuild destroys all 10,000 cubes and builds new ones.
| Rebuilds | Cleanup OFF | Cleanup ON |
|---|---|---|
| First build | 10,348 | 10,362 |
| Rebuild 1 | 20,348 | 10,362 |
| Rebuild 2 | 30,348 | 10,362 |
| Rebuild 3 | 40,348 | 10,362 |
Without cleanup, the count grew by exactly 10,000 per rebuild: one orphaned material per destroyed cube. Destroying a GameObject does not destroy the material that renderer.material cloned for it. With Destroy(material) on each clone, the count stayed flat.
I only counted objects; I did not measure how many MB 10,000 URP/Lit materials actually cost.
The rule “MaterialPropertyBlock fixes renderer.material” comes from the Built-in Render Pipeline. URP batches by a different principle, and that changes the answer.
MaterialPropertyBlock documentation warns about this for URP/HDRP. The Frame Debugger’s batch cause, “Objects have different MaterialPropertyBlock set”, says the same thing for every cube.So in URP, renderer.material costs memory and ownership, while the property block costs CPU time. The “fix” traded a smaller problem for a bigger one.
| Situation | Approach |
|---|---|
| A few distinct colors (team colors, states) | A handful of shared materials, assigned with sharedMaterial |
| Unique values per object, moderate count | renderer.material is acceptable, but I own the clones and must Destroy() them |
| A few objects, or no SRP Batcher in play | MaterialPropertyBlock is fine |
| Thousands of unique colors | GPU instancing with a per-instance color shader (a separate experiment) |
The general lesson: a performance rule is only true for the pipeline it was measured in. Measure before trusting it.
I went in expecting MaterialPropertyBlock to win on both memory and batching. In URP it won on memory and lost badly on speed: 46 vs 20,024 SetPass calls, and about 21 ms vs 131 ms on the main thread.
The part of the old rule that survived is the ownership lesson. renderer.material creates objects you are responsible for, and my leak test showed exactly what happens when nobody destroys them.
The most useful thing I took away isn’t either API. It’s the habit of writing the prediction down first, so a wrong rule gets caught instead of repeated.